HUNGER IN NEW MEXICO RESEARCH
Every week in New Mexico, Roadrunner® Food Bank provides food to tens of thousands of children, adults, and seniors who do not have enough to eat. The reason we have access to statistics like this is thanks to research. Research gives us a peek into the lives of the people we serve. One major piece of hunger research we use is the Hunger in America report.
The Hunger in America 2014 – New Mexico Study provides a comprehensive demographic profile of people seeking food assistance through the charitable hunger relief network in the state and across the country. It provides an in-depth analysis of people who are experiencing hunger. The quadrennial study, released in 2014, was done in partnership with Feeding America (the nation’s largest domestic hunger-relief organization), and its member food banks across the country such as Roadrunner Food Bank.
A Few Key Findings from the Report
- Hunger and poverty go hand-in-hand in New Mexico. 83 percent of families experiencing hunger earn $20,000 or less a year, leaving many families to make difficult choices.
- More than 50 percent of the households seeking food assistance include an employed person. The remaining are often in poor health, have a disability, are caretakers for a loved one, or are retired.
- 89 percent of clients seeking food from charitable food assistance programs reside in stable housing, meaning a majority of people seeking help have a reliable home or apartment to live in.
- More than 25 percent of households include a member who has served in the United States military.
- While a portion of households in our food lines may be eligible for and receive SNAP (food stamp) benefits, often many do not apply for the federal nutrition program benefits as they believe they will not qualify based on their income.
- 41 percent of people experiencing hunger water down their food or drink, and 76 percent purchase inexpensive, unhealthy food (if a small food budget is available) as coping strategies.
The report provides additional details (see below or review New Mexico’s executive summary) such as demographic information about the New Mexicans we serve, health and hunger, and trade offs that food insecure households make. Review the national report on Feeding America’s website.
DEMOGRAPHICS OF WHO WE SERVE
The Hunger in America – New Mexico report provided demographics of the people we serve across the state. It showed that in addition to helping 70,000 New Mexicans a week, those we serve are from the following age groups and backgrounds.
- 29 percent are 17 and under
- 50 percent are ages 18-59;
- 21 percent are 60 and older
People in food lines in our state also are from the following background and ethnicities.
- 7.6 percent are American Indian
- 2.4 percent are African American;
- 65.3 percent are Hispanic
- 18.9 percent are White
- The remaining did not list a race

FOOD INSECURE HOUSEHOLDS MAKE TRADE OFFS

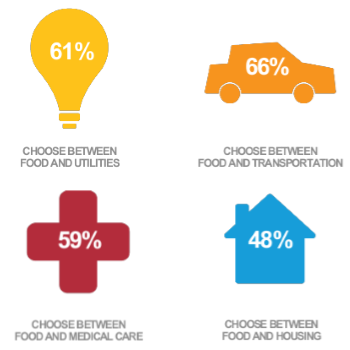
The clients who were surveyed as part of the study reported making trade offs to deal with food insecurity. Clients often survive on limited budgets and are confronted with choosing between competing necessities. Below are a few of the the difficult trade offs that families experiencing hunger make on a regular basis.
- 61 percent of households choose between food and utilities;
- 66 percent of households choose between food and transportation;
- 59 percent of households choose between food and medical care, and;
- 48 percent of households choose between food and housing.
These choices may mean that entire families go without food or access to nutritious food, including children and seniors, for whom good nutrition is especially important. In addition families struggling with these trade offs also reported that if they had a food budget, 75 percent purchased inexpensive, unhealthy food to have some food on hand. It means that our families facing hunger can’t afford nutritious food. It also means that the health of people experiencing hunger is compromised.
HEALTH AND HUNGER
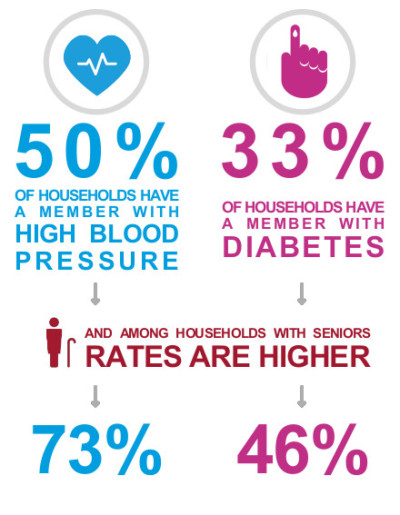
The report showed that a significant number of families in food insecure households had someone in the home who had diabetes or high blood pressure. When evaluating households with food insecure seniors, the rates of diabetes and high blood pressure were significantly higher than the rest of the population. The infographic shows the rates of chronic health issues in food insecure homes and those of seniors. .
- 50 percent of food insecure households have someone in the home with high blood pressure;
- 33 percent of food insecure households have someone in the home with diabetes ;
- Rates for seniors experiencing hunger are 73 percent of homes with high blood pressure and 46 percent with diabetes.
Additional studies by Feeding America, FRAC, and others continue to look at the impact of health and hunger.

